What's a Good Engagement Rate in 2026? (Benchmarks by Platform)


Last updated: May 2026 — refreshed with the Quid/Rival IQ 2026 Social Media Industry Benchmark Report (18 industries, 5 platforms), Buffer's 52-million-post 2026 study, and Socialinsider's 70M-post benchmark.
"Is my engagement rate good?" is the question every marketer and creator asks — and most get wrong. A 2% engagement rate on Instagram is mediocre for a 5K-follower account but excellent for one with 500K followers. Context matters, and without platform-specific benchmarks broken down by account size, format, and industry, you're flying blind.
This guide compiles the latest 2026 engagement rate benchmarks across every major platform so you can see exactly where you stand. We'll cover what counts as a "good" rate, how engagement is calculated, what's changed this year, and how to improve your numbers. Every number below is sourced from a verified 2026 study — primarily Quid (formerly Rival IQ), Buffer, Socialinsider, and Dash Social.
TL;DR
| Platform | Average engagement rate (May 2026) | "Good" threshold | Source |
|---|---|---|---|
| Instagram (brand accounts) | 0.30–0.48% | Above 1.0% | Quid / Socialinsider |
| Instagram Reels | 1.10–1.23% | Above 2.0% | Socialinsider |
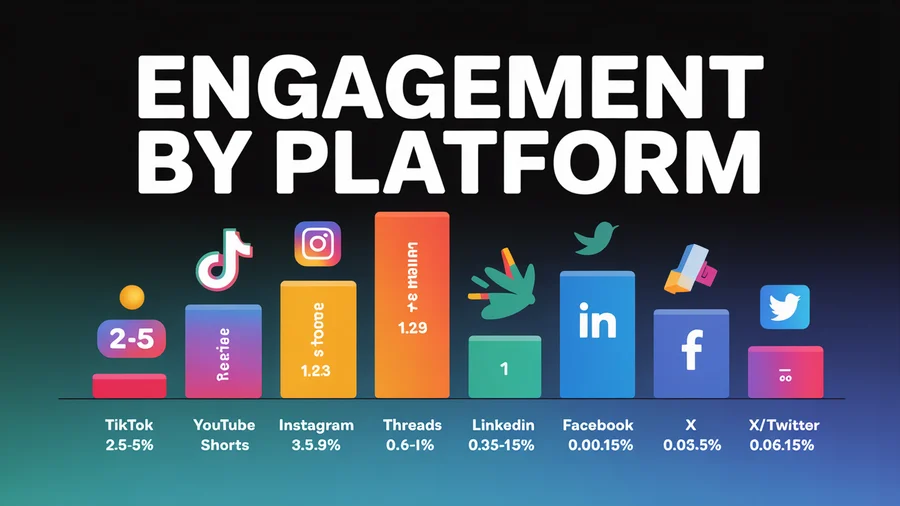
| TikTok | 2.01–3.70% | Above 4.0% | Quid / Socialinsider |
| LinkedIn (company pages) | 0.35–0.50% | Above 0.8% | Buffer |
| LinkedIn carousels | 21.77% (median) | Above 25% | Buffer |
| 0.15% | Above 0.20% | Quid | |
| X/Twitter | 0.03–0.12% | Above 0.15% | Quid |
| YouTube (long-form) | 1.50–3.00% | Above 3.5% | Buffer |
| YouTube Shorts | 3.00–5.91% | Above 5.0% | Blogging Wizard |
| Threads | 0.60–1.00% | Above 1.5% | Buffer |
Quick Stats at a Glance (May 2026)
20 numbers worth memorising — every one verified to a 2026 source:
- TikTok engagement rate: 3.70% (Socialinsider) / 2.01% (Quid) — leads every platform — Socialinsider
- TikTok YoY change: +49% (largest jump of any platform) — Socialinsider
- Instagram engagement: 0.30% (Quid) / 0.48% (Socialinsider), down ~17% YoY — Quid
- Facebook engagement: 0.15%, flat YoY — Quid
- X engagement: 0.12% (rebound from 2024 low of 0.015%) — Quid
- LinkedIn carousels: 21.77% median — highest format engagement on any platform — Buffer
- LinkedIn video: 7.35% median engagement — Buffer
- Instagram carousels: 6.90% engagement rate — Buffer
- Instagram Reels: 3.31% engagement rate — Buffer
- Threads video: 5.55% (highest performing format on Threads) — Buffer
- TikTok shares: +45% YoY (fastest-growing interaction metric) — Socialinsider
- Reply lift across platforms: +42% Threads, +30% LinkedIn, +21% Instagram when creators reply to comments — Buffer
- Brands post on Instagram 3.7x/week vs TikTok 2x/week — yet TikTok still wins engagement — Quid
Table of Contents
- How Engagement Rate Is Calculated
- Instagram Engagement Rate Benchmarks
- TikTok Engagement Rate Benchmarks
- LinkedIn Engagement Rate Benchmarks
- Facebook Engagement Rate Benchmarks
- X/Twitter Engagement Rate Benchmarks
- YouTube Engagement Rate Benchmarks
- Threads Engagement Rate Benchmarks
- 2026 Benchmark Updates
- Engagement Rate by Content Format
- What's a Good Engagement Rate by Industry?
- How to Calculate Your Engagement Rate
- Why Your Engagement Rate Is Dropping
- Engagement Rate vs Vanity Metrics
- Engagement by Content Format
- Why Engagement Rates Are Declining (And What to Do)
- How to Improve Your Engagement Rate
- FAQs
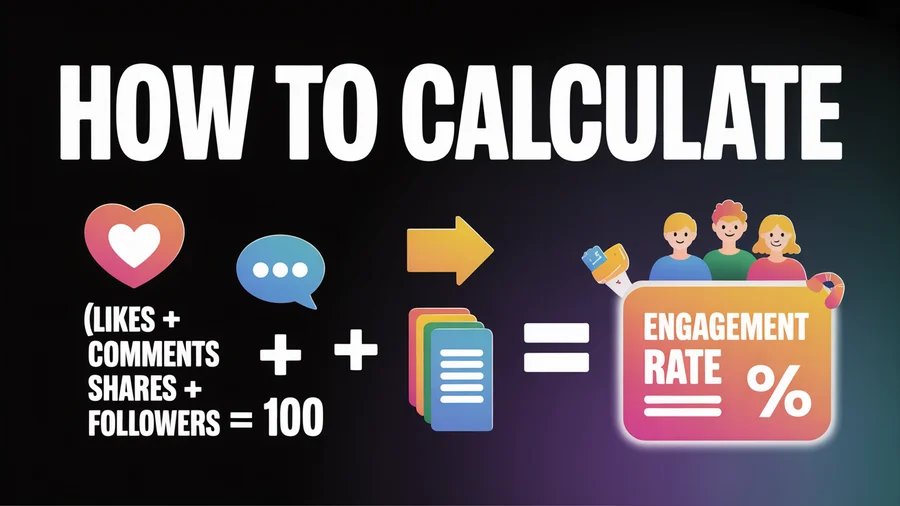
How Engagement Rate Is Calculated
There are two common formulas. Make sure you're using the same one when comparing your numbers to benchmarks.
Engagement rate by followers (ERF)
ERF = (Likes + Comments + Shares + Saves) / Followers × 100
This is the most widely used formula and the one most benchmark studies reference. It measures how engaged your existing audience is.
Engagement rate by reach (ERR)
ERR = (Likes + Comments + Shares + Saves) / Reach × 100
This measures how engaging your content is to everyone who saw it — including non-followers. ERR is typically higher than ERF because reach is usually smaller than total followers.
Most benchmarks in this guide use ERF (by followers) unless noted. Calculate your own rate instantly with our engagement rate calculator. For the qualitative side — what actually makes a post engaging in the first place — pair this with our guide to creating engaging social media posts.
Instagram Engagement Rate Benchmarks
Instagram engagement has declined steadily as the platform grows and the feed becomes more algorithmic. Here's where things stand in 2026.
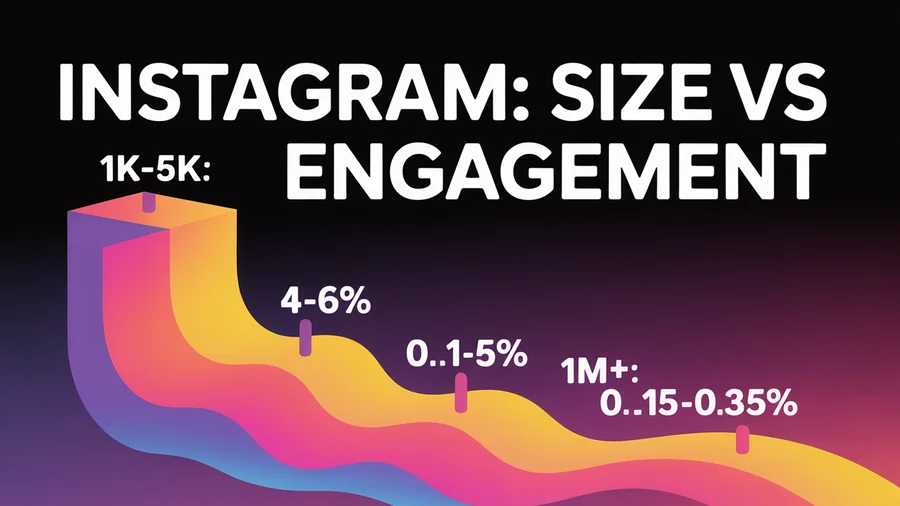
Average engagement rates by account size
| Followers | Average engagement rate |
|---|---|
| 1K–5K | 4.0–6.0% |
| 5K–20K | 1.5–3.0% |
| 20K–100K | 0.8–1.5% |
| 100K–500K | 0.5–0.8% |
| 500K–1M | 0.3–0.5% |
| 1M+ | 0.15–0.35% |
Overall average across all accounts: 0.30–0.48% (source: Instagram engagement rate benchmarks by Socialinsider) — down roughly 17% year-over-year according to Rival IQ's 2026 benchmark report
Engagement by content format
| Format | Average engagement rate |
|---|---|
| Reels | 1.23% |
| Carousels | 0.85–1.05% |
| Static images | 0.45–0.65% |
| Stories | 3–5% reach rate |
Reels dominate — they generate nearly 2x the engagement of static images and have the highest reach rate of any Instagram format. If you're not posting Reels, you're leaving engagement on the table. Learn how to use them effectively in our Instagram Story ideas guide.
Carousels are the second-best format, especially for saves and shares. Educational carousels with swipeable tips consistently outperform single images.
Schedule your highest-engagement formats with PostEverywhere's Instagram tools and track performance over time.
What's changed in 2026
- Overall engagement fell from 0.36% to 0.30% (Rival IQ), continuing the multi-year decline as follower counts grow faster than interaction rates
- Average comments per Instagram post dropped 16% year-over-year, reflecting a shift toward passive consumption
- Reels engagement is holding steadier than feed posts but no longer immune to the decline
- Saves and shares now carry more algorithmic weight than likes
- Smaller accounts (<10K) consistently outperform larger ones in engagement rate
TikTok Engagement Rate Benchmarks
TikTok still leads all platforms in raw engagement rate, though the gap is narrowing.
Average engagement rates
| Followers | Average engagement rate |
|---|---|
| 1K–10K | 6.0–10.0% |
| 10K–50K | 3.5–6.0% |
| 50K–100K | 2.0–4.0% |
| 100K–500K | 1.5–2.5% |
| 500K+ | 1.0–2.0% |
Overall average: 2.01–3.70% (varies significantly by niche and study). Rival IQ's 2026 benchmark measured TikTok at 2.01% for brands — still topping every other platform by a wide margin. Digital Information World reports TikTok engagement soared 49% year-over-year to 3.70% when measuring creator accounts.
TikTok's engagement rate is calculated differently by many tools — some include views in the denominator, others use followers. Make sure you're comparing apples to apples.
What's changed in 2026
- TikTok now shows new videos to followers first before pushing to non-followers — this slightly increases follower-based engagement rates but can reduce viral reach for new accounts
- Longer videos (1–3 minutes) get more comments than ultra-short clips, because there's more content to discuss
- Average comments per TikTok video dropped 24% year-over-year, but TikTok still leads all platforms in total engagement per post
LinkedIn Engagement Rate Benchmarks
LinkedIn has the most engaged professional audience, but engagement rates look lower because the platform defines "engagement" differently.
Average engagement rates
| Metric | Benchmark |
|---|---|
| Overall average (company pages) | 0.35–0.50% |
| Top-performing company pages | 0.80–2.00% |
| Personal profiles (thought leaders) | 2.0–6.0% |
| Document/carousel posts | 3.0–5.0% impression rate |
Best-performing content types on LinkedIn
- Document posts (carousels) — highest engagement by far; LinkedIn's algorithm favors native documents. Create them with our LinkedIn carousel maker.
- Text-only posts with a strong hook — the first line matters enormously (truncated at ~210 characters)
- Native video — 5x higher engagement than text posts
- Polls — high participation but low-quality engagement
Schedule your LinkedIn content with PostEverywhere's LinkedIn planner.
What's changed in 2026
- Personal profiles consistently outperform company pages in engagement by 3–10x
- "Long-form thought leadership" posts (800–1,600 characters) are rewarded by the algorithm
- Comment depth matters — substantive replies get more distribution than one-word reactions
- LinkedIn's algorithm increasingly favors posts that keep users on-platform over those with external links
Facebook Engagement Rate Benchmarks
Facebook engagement has been declining for years, but Groups remain a bright spot.
Average engagement rates
| Context | Average engagement rate |
|---|---|
| Facebook Pages (organic) | 0.06–0.15% |
| Facebook Groups | 0.50–1.50% |
| Facebook Reels | 0.15–0.40% |
| Top-performing Pages | 0.25–0.50% |
Why Facebook engagement looks so low
Facebook Page organic reach has fallen to roughly 1.37% — meaning only 137 out of 10,000 followers see your post. When very few people see your content, engagement rate (as a percentage of followers) naturally tanks.
Facebook Groups tell a different story. Groups reach 40–50% of members per post and generate 30–50% higher engagement than Pages. If Facebook engagement matters to you, build a Group. Read our full guide on Facebook Groups for business.
Schedule your Facebook content with PostEverywhere for Facebook.
X/Twitter Engagement Rate Benchmarks
X has the lowest engagement rates of any major platform — but showed its first meaningful rebound in 2026.
Average engagement rates
| Metric | Benchmark |
|---|---|
| Overall average | 0.03–0.12% |
| Good performance | 0.15–0.30% |
| Top performers | 0.50%+ |
| Threads (multi-tweet) | 2–3x higher than single tweets |
After hitting a low of 0.015% in 2024, X engagement doubled to 0.03% in 2025 and climbed to 0.12% in early 2026 — the platform's first meaningful rebound in years.
Best-performing content on X
- Threads (5–10 tweets) — significantly higher engagement than single tweets
- Quotes and hot takes — strong opinions drive replies
- Native images — outperform text-only by 2x
- Reply-chain engagement — early replies to your own tweet compound reach
Schedule your X content with PostEverywhere for X.
Track your engagement across every platform. Use our free engagement rate calculator to see exactly where you stand.
YouTube Engagement Rate Benchmarks
YouTube measures engagement differently — views, watch time, likes, and comments all factor into the algorithm.
Average engagement rates
| Format | Average engagement rate |
|---|---|
| Long-form video | 1.50–3.00% (likes + comments / views) |
| YouTube Shorts | 3.00–5.91% |
| Top-performing channels | 5.0–8.0% |
YouTube Shorts have the highest engagement rate of any short-form video format at 5.91% — higher than TikTok (when measured consistently) and Instagram Reels. Read our full YouTube Shorts strategy guide and Shorts vs TikTok comparison for detailed breakdowns.
What drives YouTube engagement
- Watch time and completion rate are the primary algorithm signals (not raw engagement)
- Comments in the first hour boost distribution
- Subscriber conversion after watching is a strong positive signal
- Shorts funnel viewers to long-form content where deeper engagement (watch time, memberships) lives
Schedule your YouTube content with PostEverywhere's YouTube planner and find optimal posting times with best-time data.
Threads Engagement Rate Benchmarks
Threads is still maturing, but early benchmarks are emerging.
Average engagement rates
| Metric | Benchmark |
|---|---|
| Average engagement rate | 0.60–1.00% |
| Good performance | 1.50–3.00% |
| Top performers | 3.0%+ |
What works on Threads
- Conversational, authentic posts — the platform rewards discussion
- Text-first content — Threads is text-native; images and video perform well but aren't required
- Questions and opinions — drive replies, which boost algorithmic distribution
- Posts under 500 characters tend to get more engagement than longer-form text
2026 Benchmark Updates (May 2026 Refresh)
Several major shifts have reshaped the engagement landscape since early 2026. Here's what the latest data shows.
TikTok surged 49% year-over-year. Socialinsider's 2026 benchmark study (analysing 70M+ posts) measured TikTok's average engagement rate at 3.70% — up from 2.50% in 2025. The jump was driven by a 45% increase in shares per post, even as average comments dropped 24%. TikTok's algorithm now rewards content that gets forwarded via DMs over content that sparks public comments.
YouTube entered the benchmark report for the first time. The Quid 2026 report added YouTube and noted that "a new middle tier has emerged" — YouTube doesn't challenge TikTok but outperforms Facebook and X on engagement.
Instagram dropped to 0.30% (Quid). Quid's 2026 report shows Instagram engagement fell from 0.36% to 0.30% — a 17% YoY decline. Socialinsider's slightly different methodology measures Instagram at 0.48% (down 4% YoY). Either way, the trajectory is downward and the platform's push toward Reels and carousels is propping up an otherwise sliding average.
Facebook held flat at 0.15%. Engagement neither improved nor worsened. Facebook Reels and Groups remain the only formats showing growth; organic Page reach remains under 2%.
X/Twitter rebounded to 0.12%. After its 2024 low of 0.015%, X engagement doubled to 0.03% in 2025 and climbed again to 0.12% by Q1 2026 — the platform's first meaningful multi-year rebound. Algorithm changes favouring long-form posts and threads drove the recovery.
Brands publish almost 2x more often on Instagram than TikTok — and still lose. Quid's 2026 data shows brands post 3.7 times per week on Instagram vs 2.0 videos per week on TikTok, yet TikTok still generates dramatically higher engagement per post. Posting volume isn't the lever — format and platform fit are.
Shares are the new metric to watch. Across every platform, shares and saves grew faster than likes or comments in 2026. Socialinsider found TikTok shares up 45% and Instagram shares up 12% year-over-year — while comments dropped on both platforms. This reflects a broader shift toward private engagement (DM sharing, saving for later) over public interaction. On Facebook specifically, see how to see who shared your post on Facebook to identify which followers are amplifying your content.
New 2026 industries entering benchmarks: Quid added Energy and Pharma to its 18-industry list — both emerged as strong performers above-median across multiple platforms. The same report flags Beauty and Retail as the bottom of the pack in 2026, with saturated feeds dragging engagement below platform medians.
Track all of these metrics across platforms in one dashboard with PostEverywhere's analytics.
Engagement Rate by Content Format
Format choice is the single biggest lever you control for engagement. Here's how each format performs on the platforms where it matters most, based on 2026 data.
| Format | Avg. engagement rate | Best for |
|---|---|---|
| Reels (15–60s) | 1.23% | Reach and discovery |
| Carousels (5–10 slides) | 0.85–1.05% | Saves and shares |
| Static images | 0.45–0.65% | Brand consistency |
| Stories | 3–5% reach rate | Daily touchpoints |
Carousels are the engagement sleeper. They generate 2–3x more saves than any other format, and saves now carry heavy algorithmic weight. Educational "swipe-through" carousels with actionable tips consistently outperform polished branded images.
| Format | Avg. engagement rate | Notes |
|---|---|---|
| Document posts (carousels) | 3.0–5.0% impression rate | Highest by far |
| Text-only (800–1,600 chars) | 0.60–0.90% | Strong if hook is good |
| Native video | 0.50–0.80% | 5x higher than text on reach |
| Polls | 1.5–3.0% | High participation, low quality |
| Link posts | 0.20–0.40% | Algorithm suppresses external links |
Create LinkedIn carousels in minutes with our LinkedIn carousel maker. Polls generate lots of clicks but rarely lead to meaningful conversations — use them sparingly.
TikTok
| Format | Avg. engagement rate | Notes |
|---|---|---|
| Short clips (15–30s) | 4.0–6.0% | Best for virality |
| Medium videos (1–3 min) | 3.0–5.0% | Most comments |
| Photo carousels | 2.0–3.5% | Emerging format, growing fast |
| Live streams | Variable | Strong for creator loyalty |
TikTok's photo carousel format (launched late 2025) is gaining traction. Early data shows carousels earn 2.0–3.5% engagement — lower than video but with higher save rates, similar to Instagram's carousel pattern.
Cross-Platform Format Cheat Sheet (Buffer, 52M posts)
Buffer's 2026 study is the cleanest apples-to-apples format comparison available. All numbers below are median engagement rates from Buffer's State of Social Media Engagement 2026 report:
| Format | X | Threads | TikTok | ||||
|---|---|---|---|---|---|---|---|
| Video | 7.35% | 3.31% (Reels) | 4.84% | 2.96% | 5.55% | 3.39% | 5.75% |
| Carousel | 21.77% | 6.90% | — | — | — | 1.92% (photo) | — |
| Image | 6.52% | 4.44% | 5.20% | 3.40% | 4.55% | 1.92% | 3.15% |
| Text | — | — | 4.76% | 3.56% | 2.79% | — | — |
Three takeaways from this table:
- LinkedIn carousels are in their own universe at 21.77% — roughly 3x LinkedIn video, 5x Instagram carousels, and over 100x the average X engagement rate. If you're not building LinkedIn carousels, you're ignoring the highest-engagement format on social media.
- Video beats static on most platforms — but only by 1.5–2x. The bigger lever is format, not video-vs-static.
- Threads loves video (5.55%) more than most marketers realise, since the platform's text-first reputation masks how well visual content performs.
Video vs Static: The 2026 Reality
Marketers have been told for years that "video always wins." The 2026 data shows a more nuanced picture:
| Platform | Video engagement | Static (image) engagement | Video premium |
|---|---|---|---|
| 7.35% | 6.52% | +13% | |
| Instagram (Reels vs image) | 3.31% | 4.44% | -25% |
| Instagram (Reels vs carousel) | 3.31% | 6.90% | -52% |
| 4.84% | 5.20% | -7% | |
| X | 2.96% | 3.40% | -13% |
| Threads | 5.55% | 4.55% | +22% |
| 5.75% | 3.15% | +83% |
Source: Buffer 2026.
On Instagram, Facebook, and X, static images and carousels now outperform video on engagement rate — reversing the conventional wisdom. Video still wins on reach and discovery (especially Reels and Shorts), but engagement-per-impression often favours static formats. Use video to find new audiences and carousels/images to deepen engagement with the ones you already have.
Engagement Rate by Follower Tier (Cross-Platform)
The single biggest factor in your engagement rate is account size. Here's how rates change as you scale, blending data from Socialinsider and Dash Social's 2026 reports:
| Account size | TikTok | |||
|---|---|---|---|---|
| <1K (nano) | 5.0–8.0% | 8.0–12.0% | 4.0–8.0% | 0.50–1.20% |
| 1K–10K (micro) | 1.5–4.0% | 6.0–10.0% | 2.0–5.0% | 0.30–0.80% |
| 10K–100K (mid-tier) | 0.8–1.5% | 2.0–6.0% | 0.80–2.0% | 0.15–0.45% |
| 100K–1M (macro) | 0.30–0.80% | 1.5–2.5% | 0.40–1.0% | 0.08–0.20% |
| 1M+ (mega) | 0.15–0.35% | 1.0–2.0% | 0.20–0.50% | 0.04–0.12% |
The pattern is universal: as follower count grows, engagement rate falls. A 2% engagement rate is mediocre at 5K followers and exceptional at 500K. Always benchmark against your own tier.
What's a Good Engagement Rate by Industry?
A 1% engagement rate means something completely different for a fitness brand than it does for a financial services company. Industry benchmarks from Socialinsider, Rival IQ, and Apaya reveal significant gaps.
Instagram engagement by industry
| Industry | Median engagement rate | Rating |
|---|---|---|
| Education / Higher Ed | 2.10–3.26% | Well above average |
| Food & beverage | 1.60–2.20% | Above average |
| Fitness & wellness | 1.40–1.80% | Above average |
| Retail & e-commerce | 1.20–1.45% | Average |
| Beauty & cosmetics | 0.80–1.94% | Wide range |
| Travel & hospitality | 0.90–1.30% | Average |
| SaaS / B2B tech | 0.30–0.60% | Below average |
| Financial services | 0.20–0.45% | Below average |
LinkedIn engagement by industry
| Industry | Median engagement rate | Rating |
|---|---|---|
| Education | 3.0–4.0% | Highest |
| Retail & consumer goods | 3.5–3.9% | Very high |
| Healthcare | 2.5–3.0% | Above average |
| Technology / SaaS | 1.8–2.1% | Average |
| Financial services | 1.2–1.8% | Below average |
| Manufacturing | 0.8–1.2% | Low |
TikTok engagement by industry
| Industry | Median engagement rate | Rating |
|---|---|---|
| Education | 6.0–7.36% | Highest across all platforms |
| Fitness & wellness | 5.0–6.5% | Very high |
| Food & beverage | 4.5–5.5% | High |
| Beauty & cosmetics | 3.5–5.0% | High |
| Retail & e-commerce | 3.0–4.0% | Average for TikTok |
| SaaS / B2B tech | 1.5–2.5% | Below average |
Key takeaway: If you're in SaaS or financial services and your Instagram engagement is 0.5%, you're actually performing above your industry benchmark — not below the platform average. Always compare against your vertical, not the overall number. Use our social media benchmarks tool for instant industry-specific comparisons.
How to Calculate Your Engagement Rate
There are four common formulas, and each gives a different number for the same post. Here's when to use each one.
1. Engagement rate by followers (ERF) — the standard
ERF = (Likes + Comments + Shares + Saves) / Followers x 100
Use when: Comparing your performance to published benchmarks (most studies use this formula). Best for tracking your own trend over time.
Limitation: Inflated for accounts with low follower counts. Deflated for accounts whose posts reach far beyond their follower base (common on TikTok).
2. Engagement rate by reach (ERR) — the most accurate
ERR = (Likes + Comments + Shares + Saves) / Reach x 100
Use when: You want the truest measure of content quality. This tells you what percentage of people who actually saw your post chose to interact.
Limitation: Reach data isn't always available (especially for competitors). ERR numbers look higher than ERF because reach is always smaller than follower count.
3. Engagement by impressions or daily totals
Two less-common variants. ERI divides interactions by impressions (useful for paid campaigns and on X where impressions are public) — always produces the lowest number since one person can generate multiple impressions. Daily ER divides total daily engagements by followers — useful for high-frequency posters (news publishers).
Our recommendation: Use ERF (by followers) for benchmarking and month-over-month tracking. Use ERR (by reach) for content quality decisions. Calculate yours instantly with our engagement rate calculator. For a deeper dive into which metrics matter most, read our social media metrics and KPIs guide.
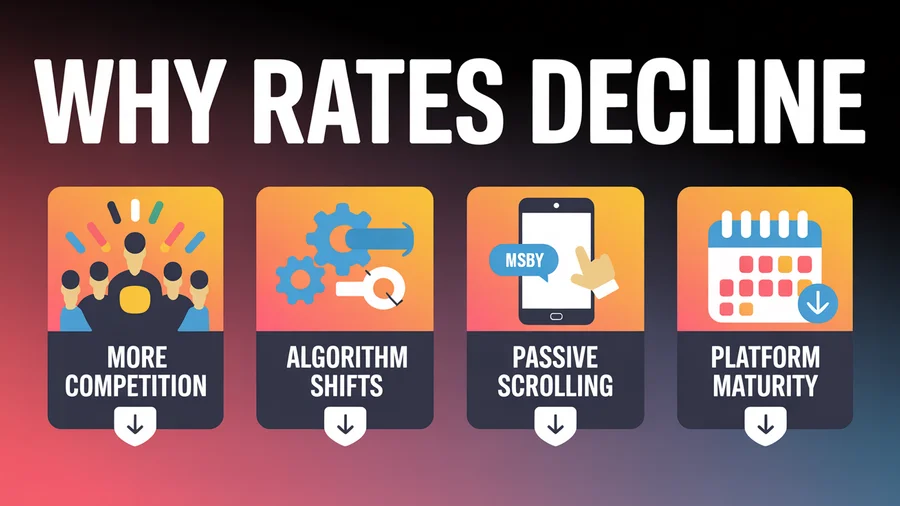
Why Your Engagement Rate Is Dropping
If your engagement has slipped over the past 3–6 months, here are the most common causes — and what to do about each one.
1. Algorithm changes you haven't adapted to. Every platform shifted toward shares and saves as primary distribution signals in 2025–2026. If your content strategy still optimises for likes and comments, you're playing last year's game. Fix: Create "saveable" content (checklists, how-tos, reference guides) and "shareable" content (hot takes, relatable memes, surprising data).
2. Posting frequency mismatch. Posting too often dilutes engagement per post. Posting too rarely means the algorithm forgets you exist. Fix: Find your platform-specific sweet spot. On Instagram, 3–5 feed posts per week. On LinkedIn, 3–4 posts per week. On TikTok, 1–2 per day. See our full posting frequency guide.
3. Audience fatigue. If your content looks the same every week — same format, same style, same topics — your audience stops paying attention even if the content is objectively good. Fix: Rotate between 3–4 content pillars. Mix formats (carousel one day, Reel the next, text post the next).
4. Follower growth outpacing engagement. If you gained followers from a viral post or paid campaign, many of those new followers may not be your core audience. Your denominator grew, but interactions didn't. Fix: Focus on attracting followers through niche content rather than broad viral content.
5. Content quality drift. Scaling content production (especially with AI) can subtly lower quality. Algorithms detect when audiences skip, mute, or scroll past your posts — and reduce distribution. Fix: Audit your last 20 posts. Identify which ones got above-average engagement and double down on that style. Use our social media audit tool for a structured review.
6. You stopped engaging back. Engagement is a two-way street. If you post and leave, the algorithm notices. Accounts that reply to comments in the first 30–60 minutes consistently see 20–40% higher distribution. Fix: Block 15 minutes after each post to respond to every comment.
Engagement Rate vs Vanity Metrics
A 10K-follower account with 5% engagement is more valuable than a 100K-follower account with 0.5% engagement. Here's the maths:
- 10K followers x 5% ER = 500 engagements per post
- 100K followers x 0.5% ER = 500 engagements per post
Same engagement volume — but the smaller account hits those 500 people at a fraction of the content cost, and those 500 are far more likely to be genuinely interested.
Why engagement rate beats follower count
For conversions: Engaged followers click, visit, and buy. A Socialinsider study found accounts with above-average engagement generate 3–5x more website clicks per 1,000 followers.
For algorithmic reach: Platforms distribute content based on early engagement signals. A post that gets 5% engagement in the first hour reaches far more people than a post from a larger account that gets 0.3%. The algorithm doesn't care how many followers you have — it cares how your content performs relative to who sees it.
For brand partnerships: Savvy brands evaluate influencers on engagement rate, not follower count. An influencer with 15K followers and 4% engagement often commands higher rates than one with 200K and 0.8%.
Measure what matters. Track engagement rate alongside reach, saves, shares, and click-through rate in PostEverywhere's analytics dashboard. Follower count is the scoreboard — engagement rate is the game.
For a complete breakdown of the metrics that actually drive growth, read our Instagram metrics and KPIs guide and our social media metrics and KPIs guide.
How to Improve Your Engagement Rate
Tactical improvements
Open with a hook. The first line of a caption, the first frame of a video — this determines whether someone stops or scrolls. Use curiosity gaps, bold claims, or direct questions.
End with a CTA. Ask a specific question ("What's your take?"), prompt saves ("Save this for later"), or drive shares ("Tag someone who needs this").
Post at optimal times. Engagement rates spike when your audience is active. Use PostEverywhere's best-time data or check your platform analytics.
Use the right format. Reels on Instagram, carousels on LinkedIn, threads on X. Match the format to the platform's strengths.
Reply to comments fast. Especially in the first 30–60 minutes after posting. This signals high engagement to algorithms and encourages more replies.
Batch and schedule. Consistency drives engagement more than any single tactic. Plan your content in a visual calendar so the cadence doesn't slip.
Strategic improvements
- Audit your content mix. Use our free audit tool to identify gaps in your engagement strategy.
- Compare against benchmarks. Use the industry benchmark comparison to see how your vertical stacks up.
- Track engagement rate monthly. Not daily — daily fluctuations are noise. Monthly trends reveal whether your strategy is working.
FAQs
What's a good engagement rate for Instagram in 2026?
Above 1.0% is considered good for most accounts in 2026. Accounts under 10K followers typically see 1.5–6.0%, while accounts over 100K average 0.3–0.8%. The platform-wide median is 0.30% (Quid) or 0.48% (Socialinsider) depending on methodology — both down from 2025. Carousels remain the strongest engagement format at 6.90%.
What's a good engagement rate for TikTok in 2026?
For brand accounts, TikTok averages 2.01% (Quid) to 3.70% (Socialinsider) — the highest of any major platform. Good is above 4%; excellent is above 6%. Smaller accounts (under 10K) routinely hit 8–12%. TikTok engagement jumped 49% YoY in 2026, driven by a 45% spike in shares per post.
Why is my engagement rate dropping even though I'm posting more?
More posts don't automatically mean more engagement. If quality drops or your content doesn't match what the algorithm rewards (video, saves, shares), increased volume can actually lower your average rate. Quid's 2026 data shows brands posting 3.7x/week on Instagram still lose to TikTok creators posting 2x/week — platform fit and format choice matter more than frequency.
Is a high engagement rate more important than follower count?
For most business objectives, yes. A 5K-follower account with 5% engagement reaches more people meaningfully than a 100K-follower account with 0.2% engagement. Engagement correlates more strongly with conversions, sales, and brand awareness than follower count alone.
How do engagement rates differ by industry in 2026?
Significantly. The Quid 2026 report shows Sports, Higher Education, and Influencers consistently outperform benchmarks. Energy and Pharma entered the 2026 report as new strong performers above the median. Beauty and Retail sit at the bottom on most platforms due to feed saturation. Compare your numbers to industry-specific benchmarks using our social media benchmarks tool.
What's the best engagement format in 2026?
LinkedIn carousels — 21.77% median engagement rate, roughly 3x LinkedIn video and 5x Instagram carousels. Buffer's 2026 study shows carousels also dominate Instagram (6.90%) and outperform Reels (3.31%). If you build for one format in 2026, build for carousels.
Has video really beaten static content in 2026?
No — the conventional wisdom is wrong for 2026. On Instagram, Facebook, and X, static images now outperform video on engagement rate. Instagram carousels (6.90%) beat Reels (3.31%) by 2x. Video still wins on reach and discovery, but engagement-per-impression often favours static formats. Use video to find new audiences and carousels to deepen engagement with existing ones.
How often should I check my engagement rate?
Weekly for quick pulse checks, monthly for meaningful trend analysis. Daily fluctuations are noise. What matters is the 30-day and 90-day trajectory.
Does posting time really affect engagement rate?
Yes — significantly. Posts published during your audience's active hours can see 2–3x higher engagement than off-peak posts. Use best-time posting to automatically schedule at optimal windows.
What's the single fastest way to boost engagement in 2026?
Reply to comments in the first 30–60 minutes. Buffer's 2026 data shows reply behaviour lifts engagement by +42% on Threads, +30% on LinkedIn, +21% on Instagram, +9.5% on Facebook, and +8% on X. It's the highest-ROI tactic on social right now — and it's free.
The Bottom Line
Engagement rate benchmarks are your reality check. They tell you whether your content is actually connecting — not just being seen. For the full picture beyond engagement rates, see our social media statistics for 2026 covering user demographics, platform growth, and advertising spend. Use the platform-specific benchmarks above to diagnose where you are, focus on the formats and tactics that move the needle, and track your trajectory monthly.
Start by calculating your current rate with the free engagement rate calculator, compare against industry benchmarks, and then schedule your optimised content with PostEverywhere. Consistency + right format + right timing = better engagement.
AI-generated content has the same engagement benchmarks as human-written — if you run the right research and writing workflow and label AI-assisted content (28% of consumers say unlabelled AI is their #1 brand dislike in 2026 per Sprout Social).
Last updated: May 15, 2026. All engagement rate benchmarks sourced from the Quid (formerly Rival IQ) 2026 Social Media Industry Benchmark Report, Buffer's State of Social Media Engagement 2026 (52M+ posts), Socialinsider's 2026 benchmark report (70M+ posts), Dash Social, and Blogging Wizard. We update this guide quarterly as new benchmark reports are published.
Founder & CEO of PostEverywhere. Writing about social media strategy, publishing workflows, and analytics that help brands grow faster.